Status of Water Resources
In many discussions so far, we have heard how important it is that information about our water resources and key trends be more readily accessible. In response, we have compiled Catchment Summaries.
Catchment Summaries
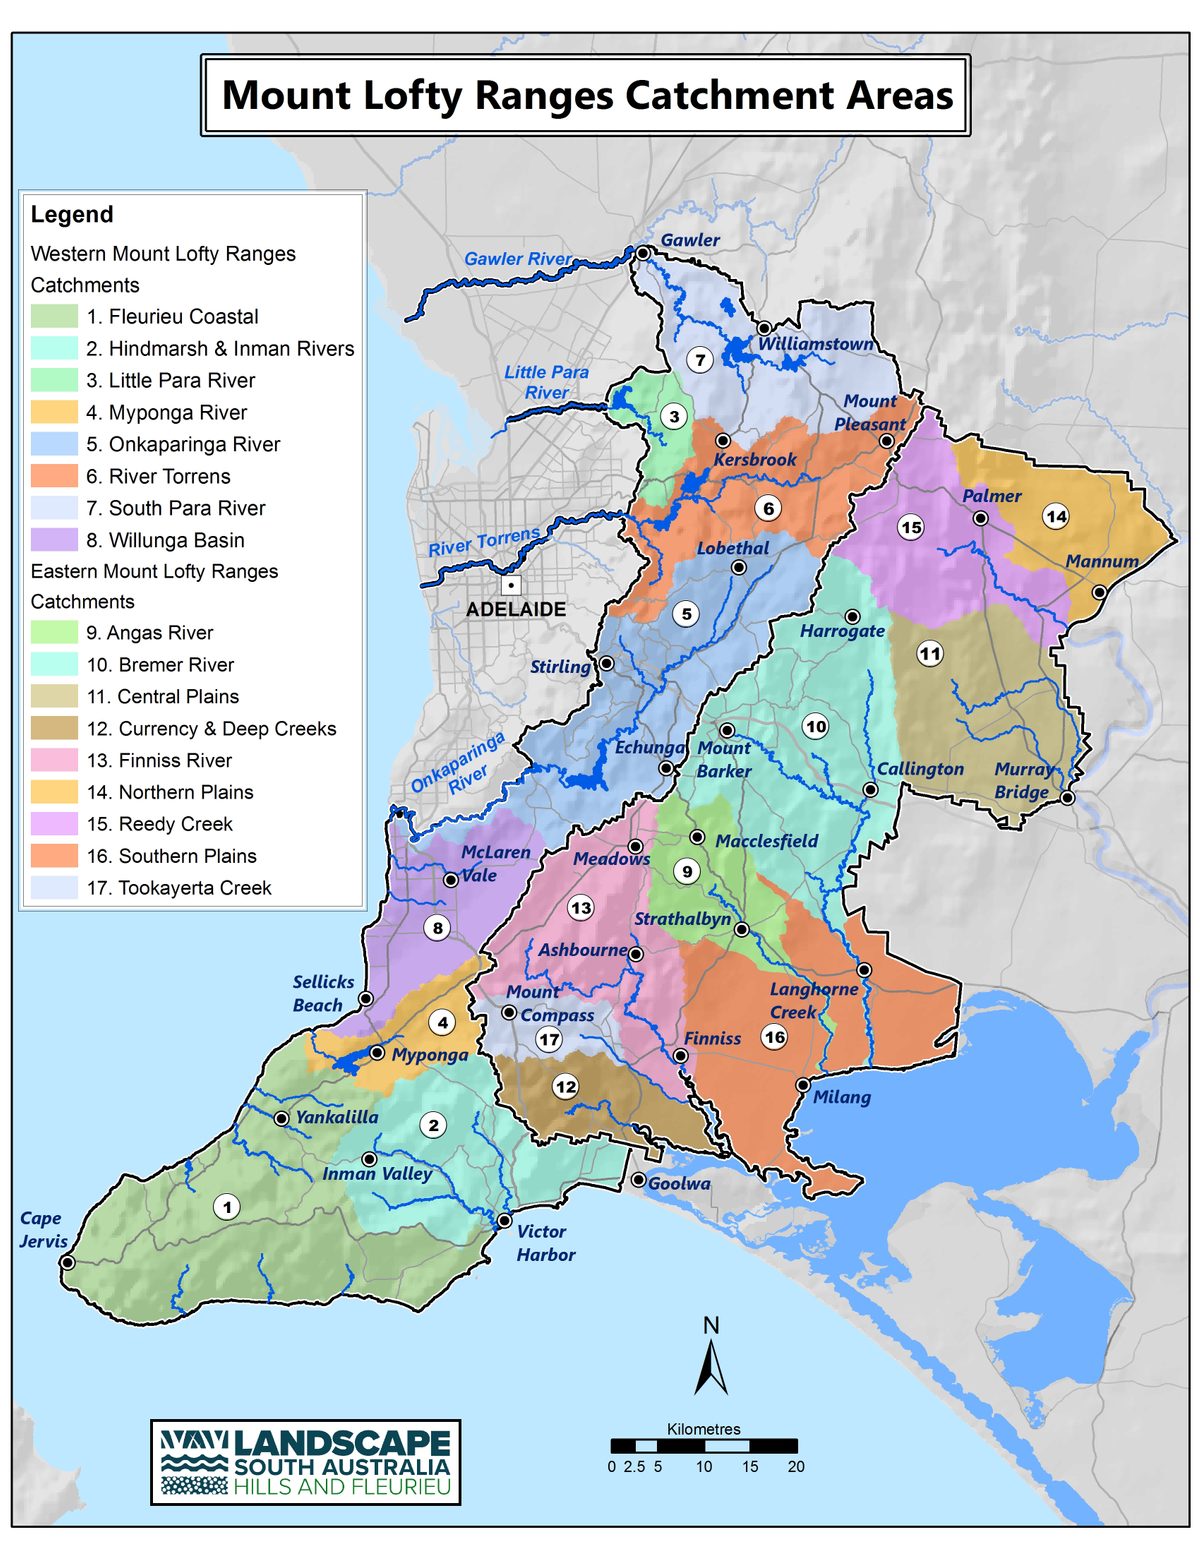
Catchment Summaries bring together data on rainfall, water resources, allocation and usage, and environmental trends for each catchment area and across the broader Eastern and Western Mount Lofty Ranges regions.
You can use the map below to find the catchment area you would like to view information on. Catchment Summary documents for each of these areas are provided below the map.

Western Mount Lofty Ranges Catchment Summaries:
- Fleurieu Coastal
- Hindmarsh & Inman Rivers
- Little Para River (coming soon)
- Myponga River
- Onkaparinga River
- River Torrens
- South Para River
- Willunga Basin
Eastern Mount Lofty Ranges Catchment Summaries:
- Angas River
- Bremer River
- Central Plains
- Currency & Deep Creeks
- Finniss River
- Northern Plains
- Reedy Creek
- Southern Plains
- Tookayerta Creek
The Catchment Summaries provide a useful overview of our water resources to help build awareness, identify important trends and inform our conversations this year and beyond. Although they are comprehensive, each around 25 pages long, even a quick flick through will offer valuable insights. A snapshot page towards the front of each Catchment Summary gives a really quick picture of key trends, and some of these are also discussed below.
To view some of the technical reports that underpin the Catchment Summaries, click here.
How are our water resources tracking?
This map shows the location of rainfall monitoring sites and the total rainfall distribution across the Eastern and Western Mount Lofty Ranges. Yellow circles are sites which have recorded rainfall over the past few decades, while yellow triangles - rainfall analysis sites – are sites where long term data has been collected since the year 1900.
The region’s water resources are carefully monitored and this information shows that there have been changes since the current water allocation plans were adopted in 2013. There are a number of significant challenges facing the regions water resources, including:
- Overall, rainfall and streamflow is declining across the Mount Lofty Ranges.
- Ecological conditions and native fish populations are declining.
- In many areas, the volumes allocated to licence holders exceed the take limits set out in the water allocation plans. Metering data (where available) shows actual volumes of use to be generally much lower than allocations.
- The surface water take limits in the current plans assume that low flows would be passed by the majority of dams, but the roll-out has been limited. Passing low flows allows the take limit to be four to five times higher than without the passing of low flows.
The evaluation this year is all about sharing information and providing opportunities to hear from you. We want to develop a clear picture of how effective the current policies and approaches have been, and where changes are needed. The conversations we have this year will set the direction for the amendment process commencing next year (2024), continuing for around two years. During the amendment process there will be time to test and explore new policies, with local communities and industries having a key role in this.
Technical Reports
The Catchment Summaries present data and other information sourced from various technical reports produced by our water science partners in the Department for Environment and Water (DEW). Some of these can be viewed below, with more on the way.
- View this report for analysis of long term rainfall and streamflow monitoring sites across the Eastern and Western Mount Lofty Ranges’ - DEW Surface Water Techincal Advice Memo_ 2023-02_FINAL
