Soil acidity project
As part of our Regenerative Agriculture Program, there has been ongoing support for long-term monitoring of soil acidity in conjunction with the Department of Primary Industries and Regions SA. In the past five to eight years there has been a profound uptake of lime spreading across EP. This monitoring survey will be a chance to keep gathering data of how pH and related toxic aluminium have progressed considering increasing acidifying nitrogen inputs.
Surveying soil acidity also gives context to the pH mapping that is occurring, because while that is good for gauging change across a paddock, it neither gives change over time nor change in depth, which is what the monitoring program can shed light on.
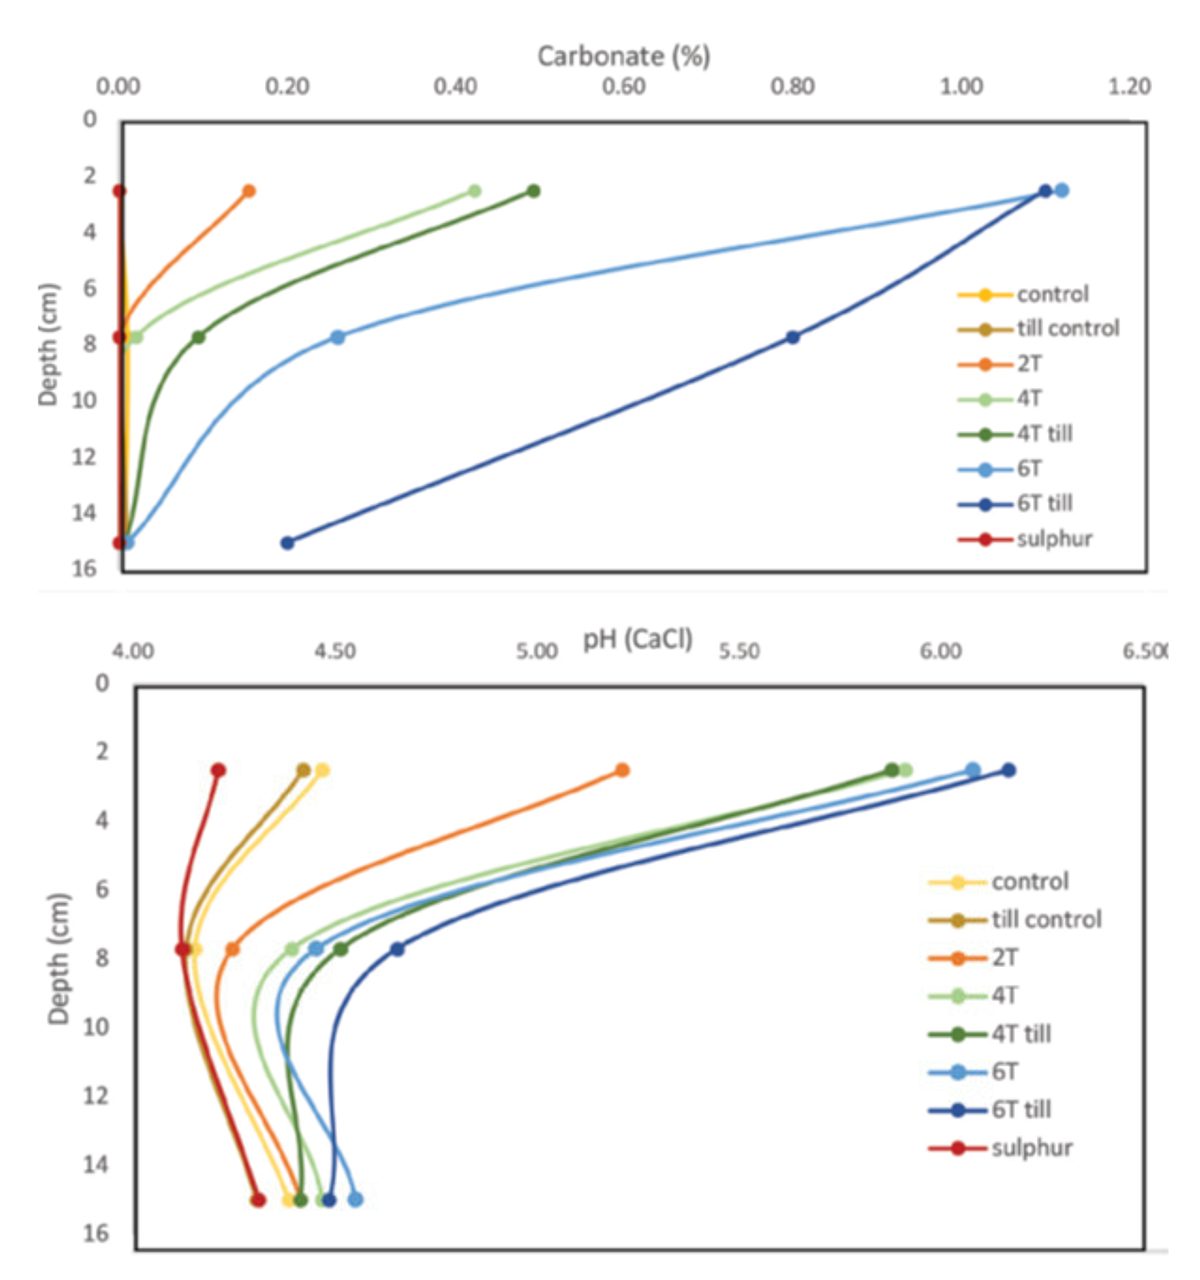
Often lime incorporation with tillage is not prioritised, and therefore doesn’t address the problem of increasing acidity at depth. More fine depth sampling when collecting soil samples into the future allows us to see that while lime is present in the surface, if sampling 0-10cm for example, it often gives a higher pH reading than if it was broken into finer increments. There is promising technology that is still in the research phase (Hum R, et al 2022 GRDC Updates) to be able to detect lime at low concentrations, which actually allows us to investigate the fate or location of spread lime (calcium carbonate) and see if and how it has moved down the profile (Figure 1). It is hoped that this approach can be integrated in the upcoming (early 2023) monitoring survey and we might be able to unpick the real benefits of things like strategic tillage from lime incorporation compared to the other extreme of sowing with no disturbance discs.

[Photo source: Detection of lime in acidic soils using mid infrared spectroscopy Hume R. et al (https://grdc.com.au/__data/assets/pdf_file/0032/572891/11749-GRDC-2022-GR-Update-AB-proceedings-Inter-Vol-2.pdf)]
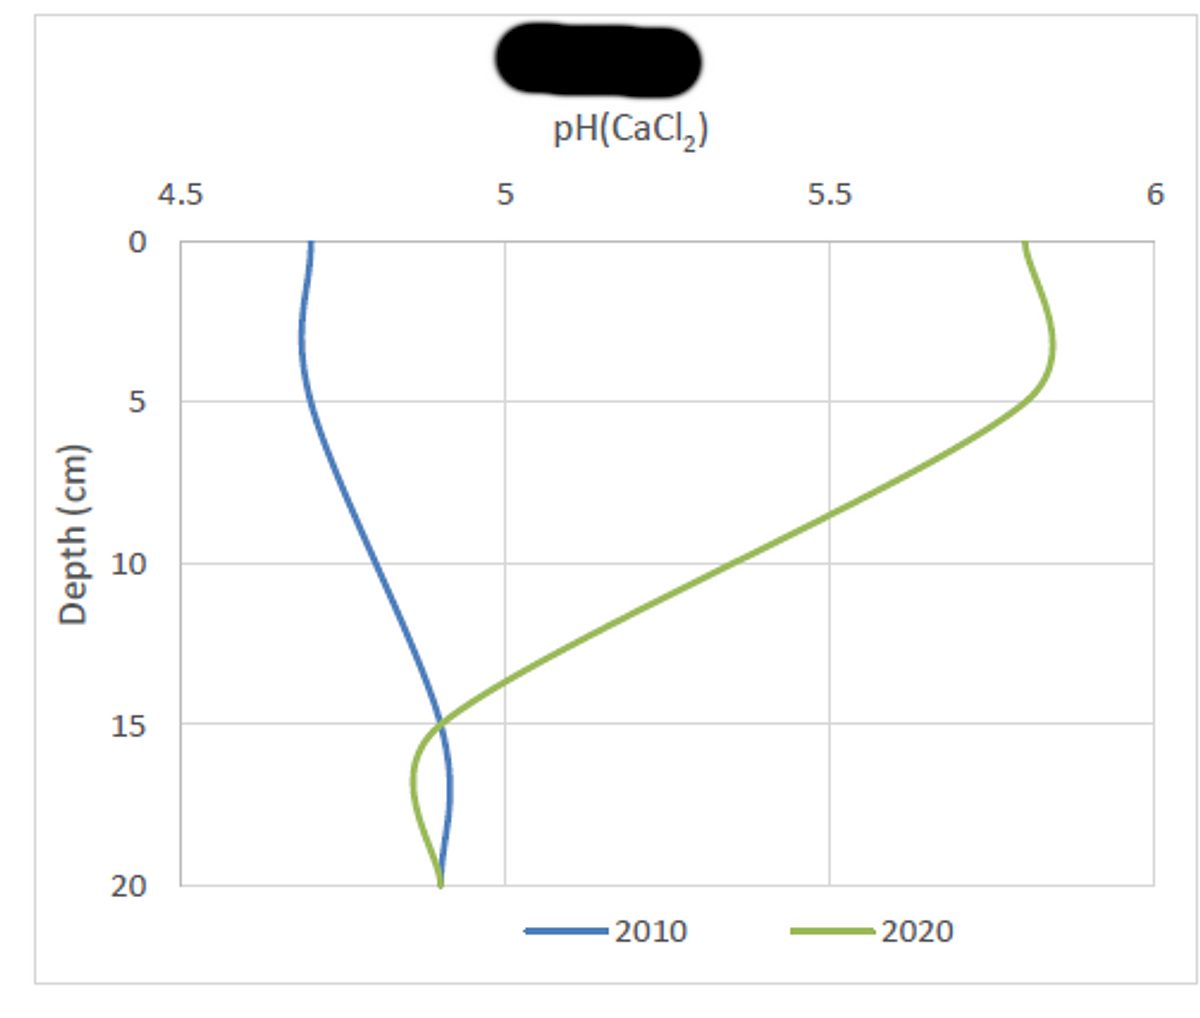
To provide an example of the value of the monitoring program, Figure 2 shows the results of long-term monitoring undertaken at a site sampled in 2010 and then again in 2020. The site will be sampled again in 2023. This shows the effect of lime applications on the surface pH, but also shows that the subsurface pH remains essentially unchanged.

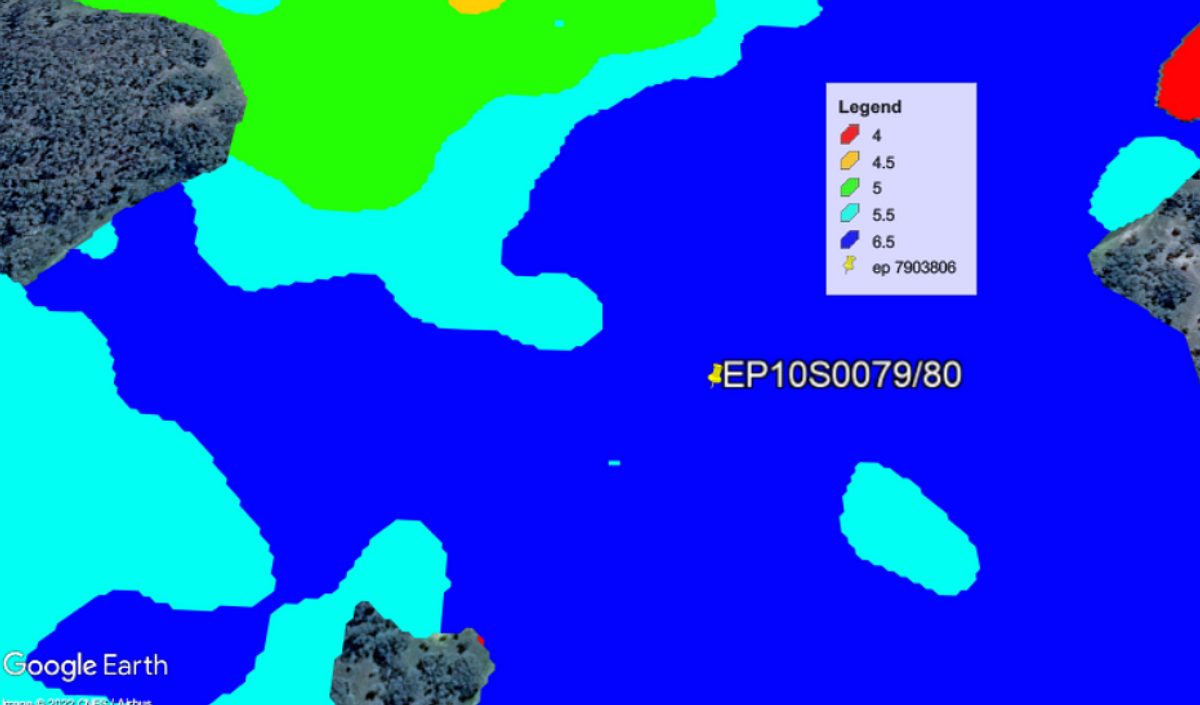
In 2022, this site was VERIS pH mapped (Figure 3), which shows a pH of 6.5, which if we didn’t have any other information we would say was not affected by acidity. However, two things:
- The original monitoring sampling was done at 0-10cm, which in 2020, would have resulted in a mixing of some of the soil from the surface with soil down to the 10cm depth which would be more acidic, giving a lower reading than if say the sample had been spilt into 0-5 and 5-10cm, which is the case with later monitoring.
- The VERIS sampling machine samples around the 4-5cm mark, so the reading would be picking up more of the surface readings, which make a difference when significant lime applications have occurred.

Take away messages:
- There can be acidity present further down the profile which can be missed by only sampling the surface.
- Pay attention to depth of surface sampling, as it makes a difference especially after liming.
- pH mapping is a useful tool, but it does have limitations.
- New tools are on the horizon to better understand the fate of applied lime, and to better design lime incorporation programs.