Climate change and Kangaroo Island
A summary of trends and projected future change
On this page:
- Supporting information
- Climate change projections
- Climate change impacts
- References
- Downloadable data files specific for Kangaroo Island
Supporting information
Climate change from human activity - mainly the release of greenhouse gases into the atmosphere and vegetation clearing - presents a significant challenge for current and future generations. This report summarises trends and projected change in Kangaroo Island climate for the twenty-first century, using newly available high resolution downscaled climate change projections released by the Bureau of Meteorology [1].
The evidence for the impacts of climate change from human activity has been developed in detail since the 1980's, with nearly 200 of the worlds major scientific organisations endorsing thousands of scientific papers and global reports on the issue [2].
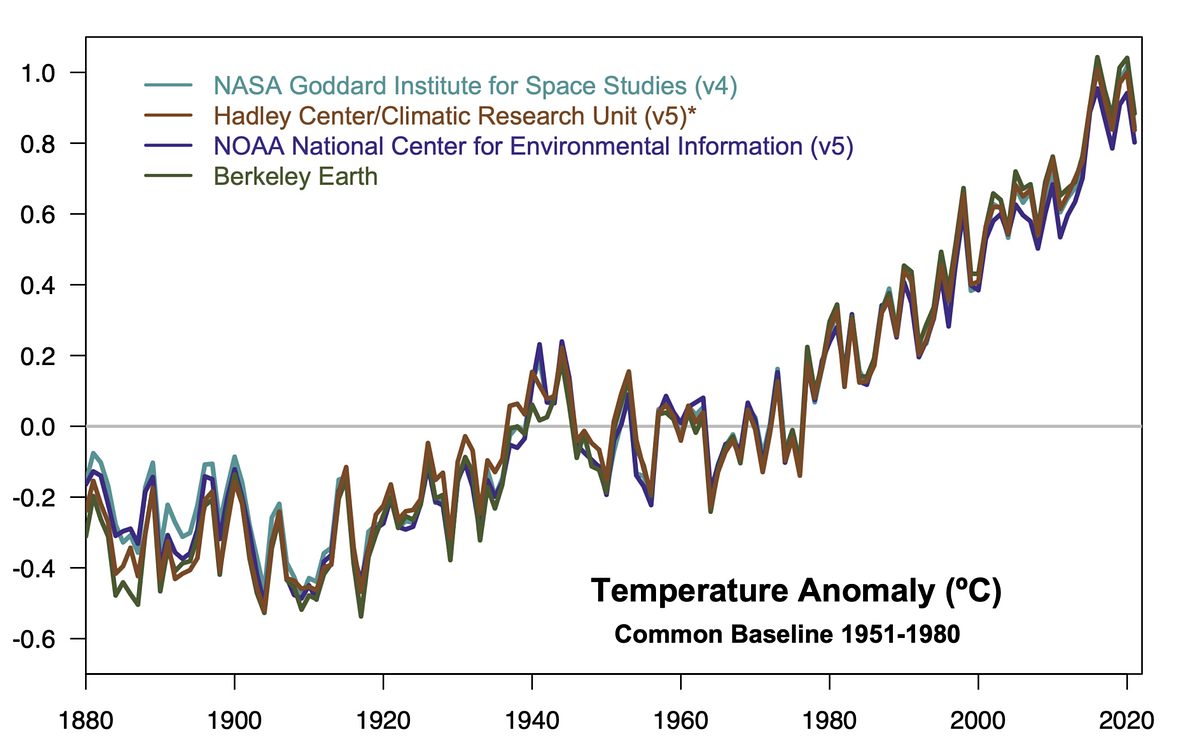
Human activity, such as burning of coal, oil and gas, methane production from livestock and rice, and cutting down of vegetation, has released large amounts of extra carbon dioxide, methane, and other greenhouse gases into the atmosphere since the start of the industrial era in the 1800's. The Sun warms up the Earth surface and the Earth then emits this energy back to space as infrared or heat energy. Greenhouse gases in the atmosphere absorb some of this heat that would otherwise go back out to space, and keep it in the Earth's climate system. To summarise the influence of increasing greenhouse gases, measurements from satellite and surface based instruments over recent decades directly confirm that the increasing amounts of greenhouse gases are leading to changes in the heat balance of the Earth, returning increasing amounts of infra-red energy to the Earth.
Climate change projections
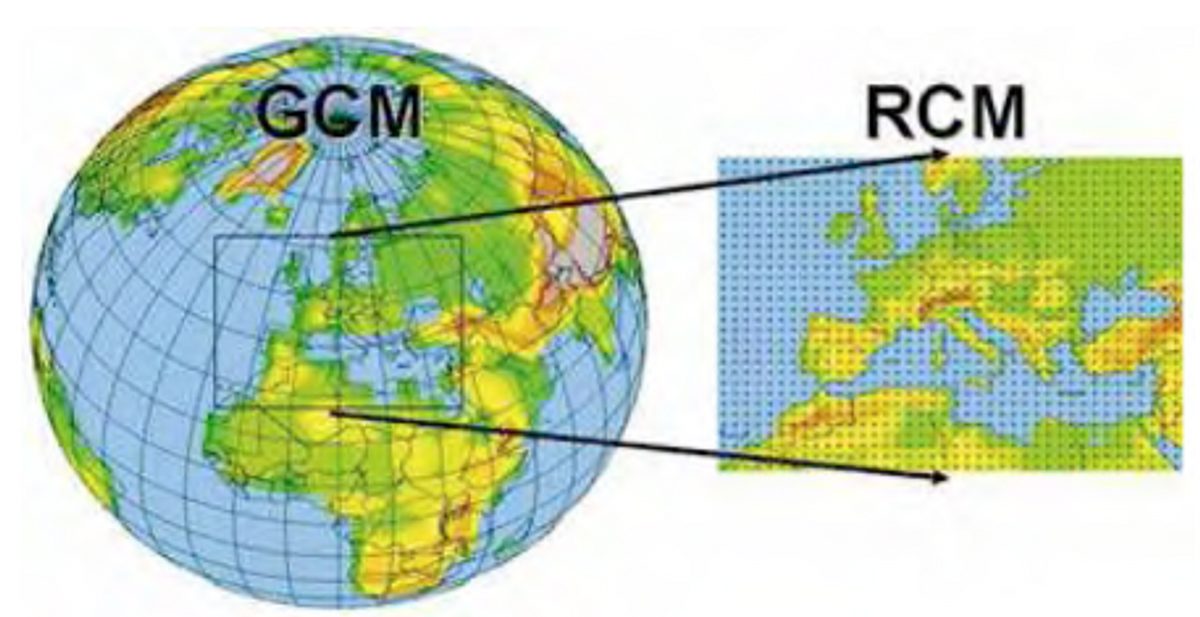
The only way to produce detailed future projections of climate change is through the use of computational models of the Earth as an ocean and atmospheric system. These have been conducted since the 1970's in increasing detail and complexity. Calculations of heat and moisture and wind movement are calculated on grid points in a computer simulation stepped forward in time from recent decades and current observations, into future decades. Typically the models are global in scale, with distances between gridpoints of 100-200 km. The models are tested against reality ( see https://climate.nasa.gov/news/2943/study-confirms-climate-models-are-getting-future-warming-projections-right/ ). But the 100-200 km resolution is not good enough to produce projections at a scale useful for somewhere like Kangaroo Island. More recently, model downscaling has been used, where a finer resolution model at Australian region scale is run within global climate change model projections. A number of different climate research centers produce similar regionally downscaled climate change projections. Most recently in the Australian Water Outlook climate change projections, the Bureau of Meteorology has produced 50 km resolution regional downscaled model projections, further statistically downscaled to 5 km resolution https://awo.bom.gov.au/about/overview/projections.
As set out in the documentation for the Australian Water Outlook Projections, this factsheet combines projections produced using four global climate models (GCM's) selected from assessments that they represent Australian climate well. These coarse resolution GCM projections were downscaled in the CSIRO CCAM regional climate model (RCM), and then statistically bias-corrected and further downscaled to 5 km using the ISIMP methodology detailed in the Australian Water Outlook documentation.

The models are run into the future with a range of possible future greenhouse gas emissions pathways. As for most downscaled climate change projections available at time of writing, only two future downscaled scenarios were available - RCP4.5 and RCP8.5.
RCP4.5 represents a future closely aligned with current increasing rates of global greenhouse gas emissions, and results in a total global warming by 2100 of around 3°C, and has been used as the future scenario for this factsheet. RCP8.5 is a scenario where massive increases in coal use happen during the twenty-first century. Prior to recent significant shifts towards renewable energy, this pathway was a possible high end outcome, but is now much less plausible, so RCP8.5 projections have not been included with RCP4.5.
The international Paris Agreement, Australia is signed on to, aims to strongly reduce and limit further greenhouse gas emissions so as to keep total global warming below 2°C. This requires emissions to be zero globally, taking offsets into account, by or preferably before 2050. This most closely aligns with scenario RCP2.6, currently unavailable in Australian regionally downscaled projections. If Paris Agreement targets are met through actions that result in stronger emissions reductions globally, this would see future changes about half the size of the projected changes seen in this factsheet.
Further general detailed technical and scientific information can be found on Climate Change in Australia https://www.climatechangeinaustralia.gov.au/en/communication-resources/reports/.
Climate change impacts

The major impacts of increasing greenhouse gases keeping more heat energy in the Earth's climate system, are increasing temperatures, being seen globally and for Australia. There are also changes in rainfall producing weather patterns, increasing atmospheric moisture availability for rainfall, and changes in regional climate influences. The Bureau of Meteorology State of the Climate 2020 report http://www.bom.gov.au/state-of-the-climate/australias-changing-climate.shtml summarises these changes for Australia. This factsheet examines this in more detail for Kangaroo Island.
As seen across Australia, increasing temperatures result in increases in heat waves and increased bushfire risk. Also, warming oceans contribute to sea level rise, as does melting of glaciers and major ice sheets in Greenland and Antarctica, important for an island location such as Kangaroo Island.
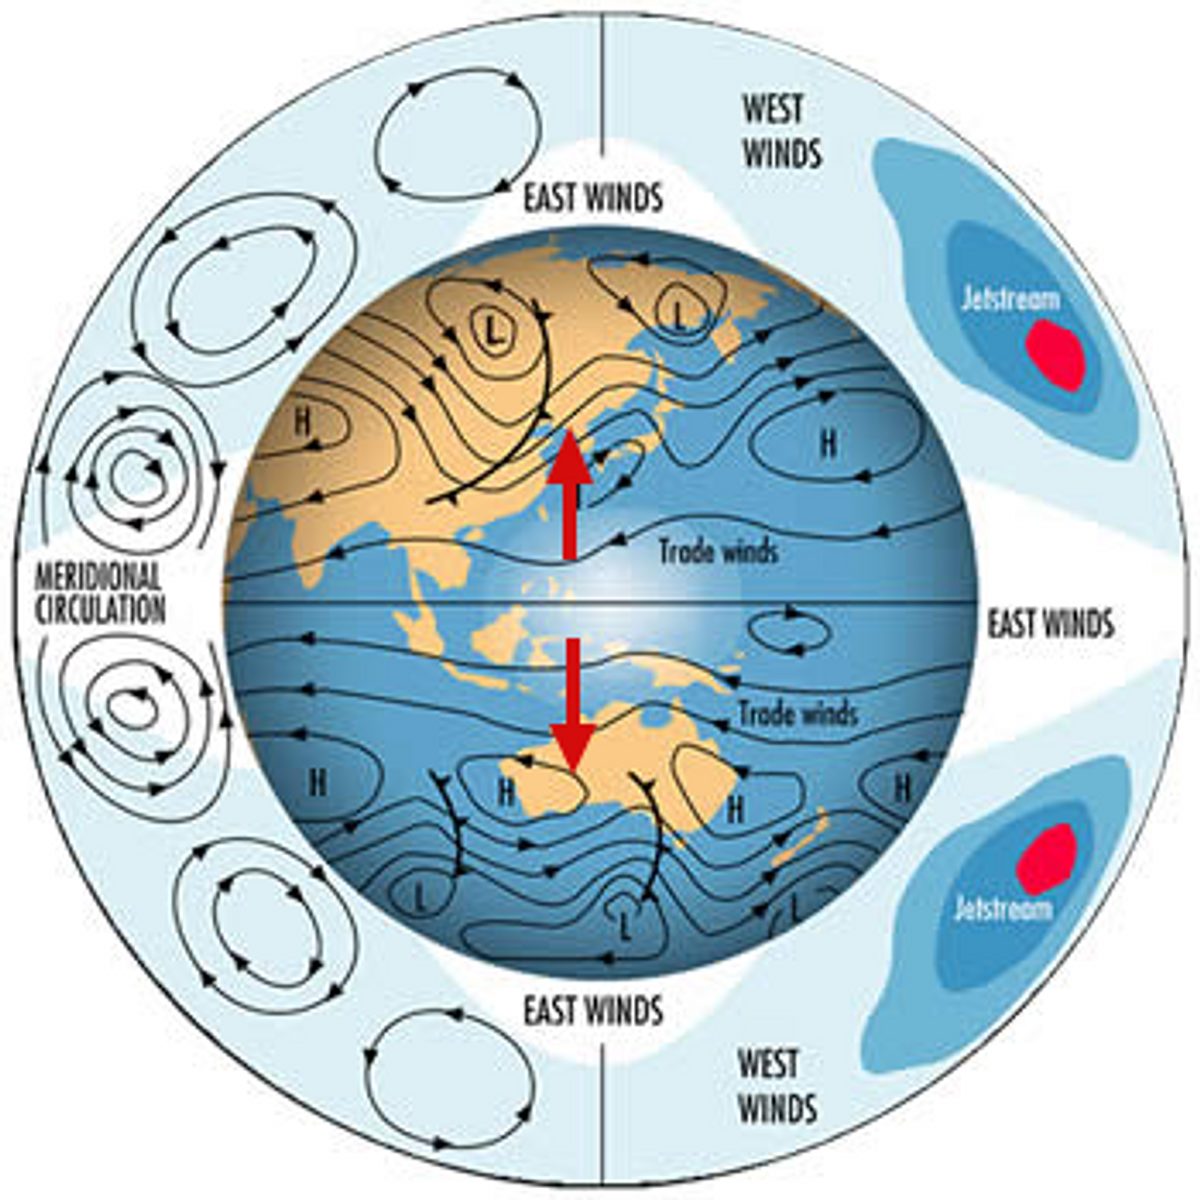
Located in the mid-latitudes of the Southern Hemisphere, Kangaroo Island rainfall is highly influenced by cold frontal systems moving over the island from the west. The tropical band around the equator expands in response to increasing global temperatures, leading to cold frontal systems staying further south over time. This is the major impact of climate change on Kangaroo Island rainfall, and is most important for April to October rainfall.

The other major impact on Kangaroo Island rainfall is through changes to broadscale climate influences such as El Nino and La Nina events in the Pacific Ocean, and Indian Ocean Dipole events originating in the northern Indian Ocean to the northwest of Australia. These influence rainfall from year to year, most particularly from August to March for El Nino/La Nina events, and August to November for the Indian Ocean Dipole. For more information on these influences see http://www.bom.gov.au/climate/about/?bookmark=enso and http://www.bom.gov.au/climate/about/?bookmark=iod. In summary, increasing ocean temperatures and changes in tropical winds are anticipated to lead to increasing rainfall extremes. Years with drier influences will tend to be drier than otherwise, and years with wet influences wetter than otherwise, particularly for the time of year these influences operate. And while Kangaroo Island will overall receive less rainfall, it is likely to come in less frequent but more intense rainfall events.
References
[1] https://awo.bom.gov.au/about/overview/projections
[2] https://climate.nasa.gov/scientific-consensus/
[3] http://www.bom.gov.au/state-of-the-climate/
Downloadable data files for specific Kangaroo Island locations
Data .csv files of daily and monthly timescale past and projected future climate, suitable for use in Excel or other similar software, are available from https://www.dropbox.com/sh/pxhl3vg1dpsw5dp/AAAjOQ94WJvadjCgv6ZtUY6Va?dl=0
These have been produced from extracting data from the closest climate projection grid point locations to Parndana, American River, Rocky River, Penneshaw and Kingscote.
More information
Manager Sustainable Landscapes
35 Dauncey Street, Kingscote SA
+61 08 8553 2476
